logbook
Strobo 2.0 Progress / Logbook / 2026 04 21 sweep complete
Status: sweep executed, plots generated, observations recorded. Operator: uwarring (with Claude) Upstream log: 2026-04-21-kickoff.md (v0.3 parameter set).
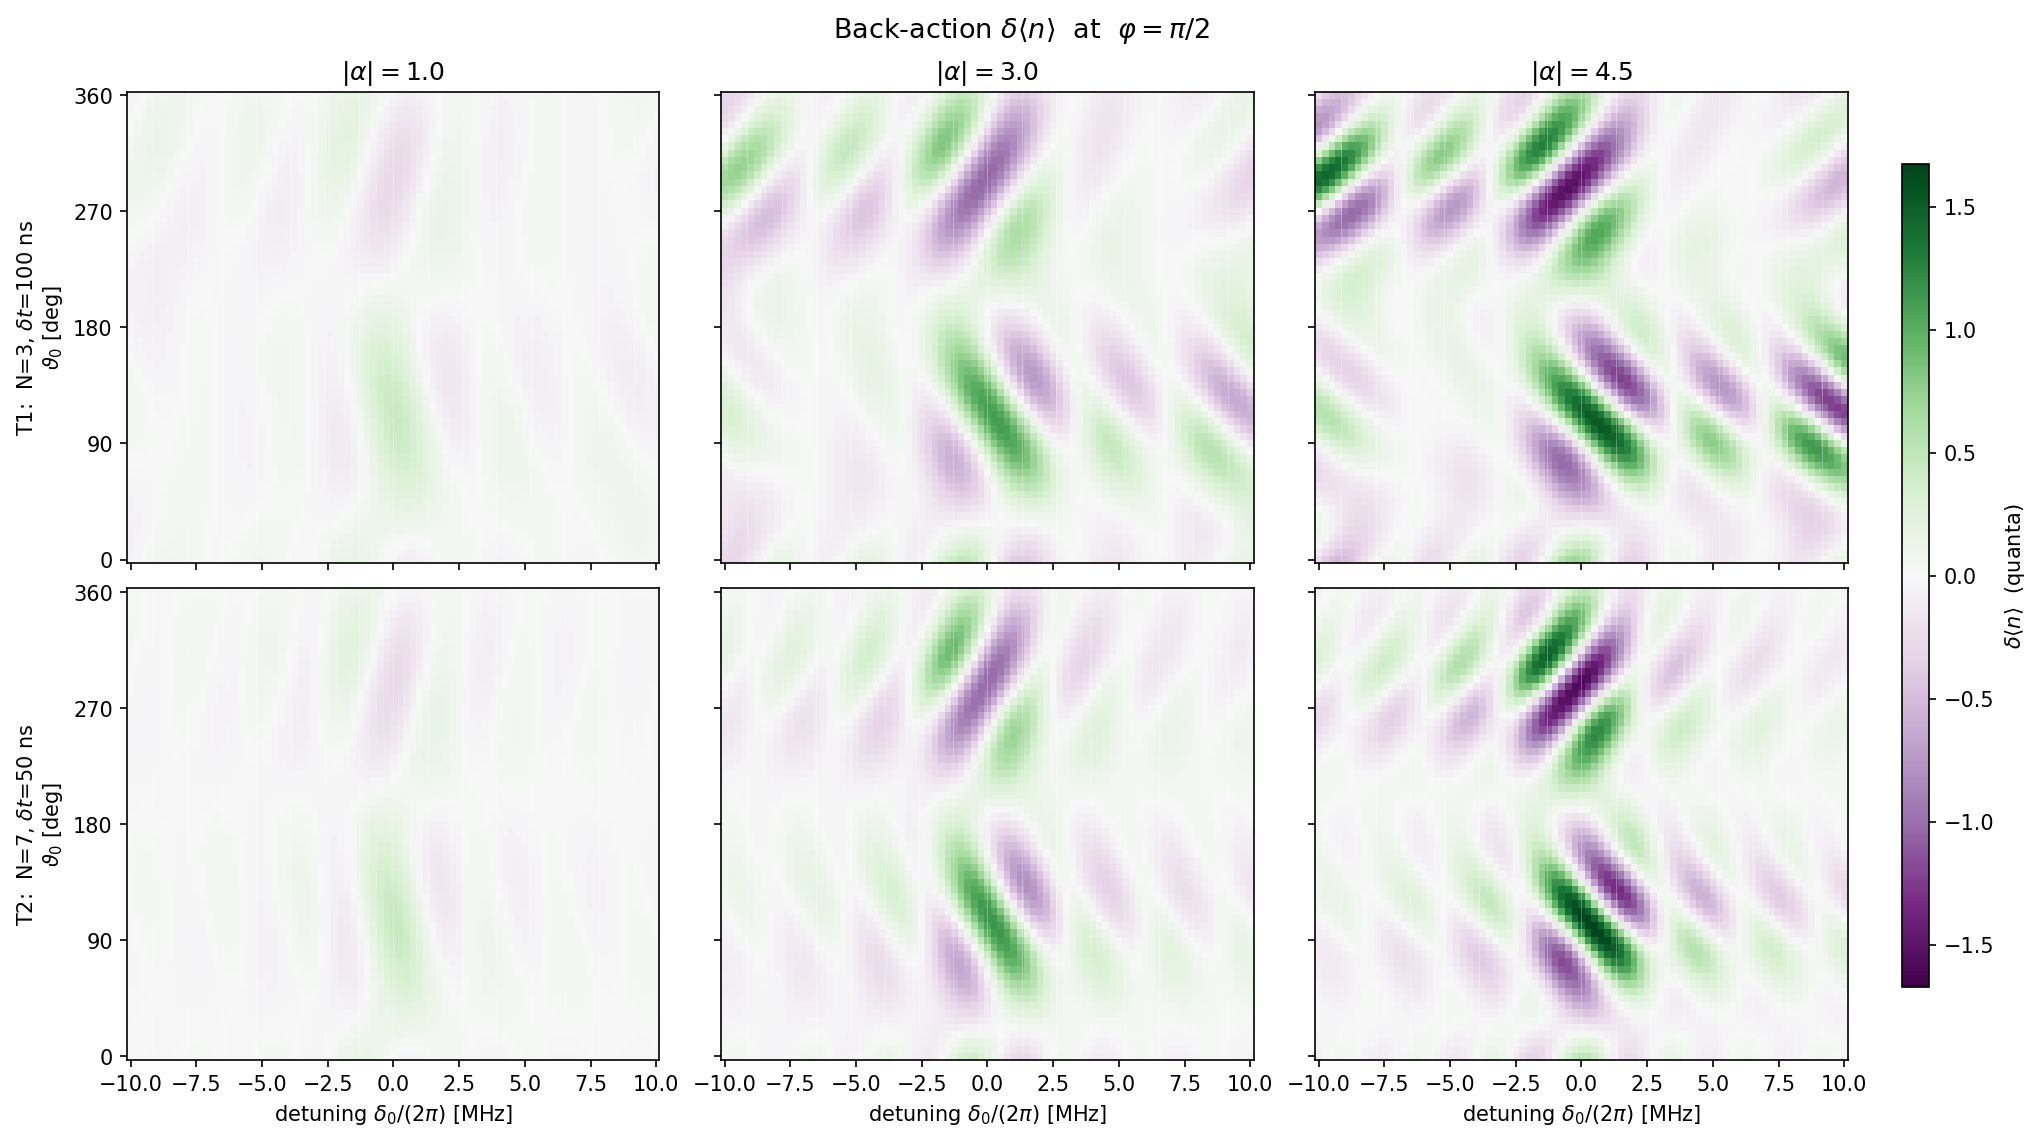
N·Ω·e⁻η²⁄²·δt = π/2.| Tag | max |C| | max |σ_z|_{φ=0} | max|δ⟨n⟩|_{φ=0} | max|δ⟨n⟩|_{φ=π/2} |
|---|---|---|---|---|
| T1, |α|=1 | 0.943 | 0.920 | 0.376 | 0.435 |
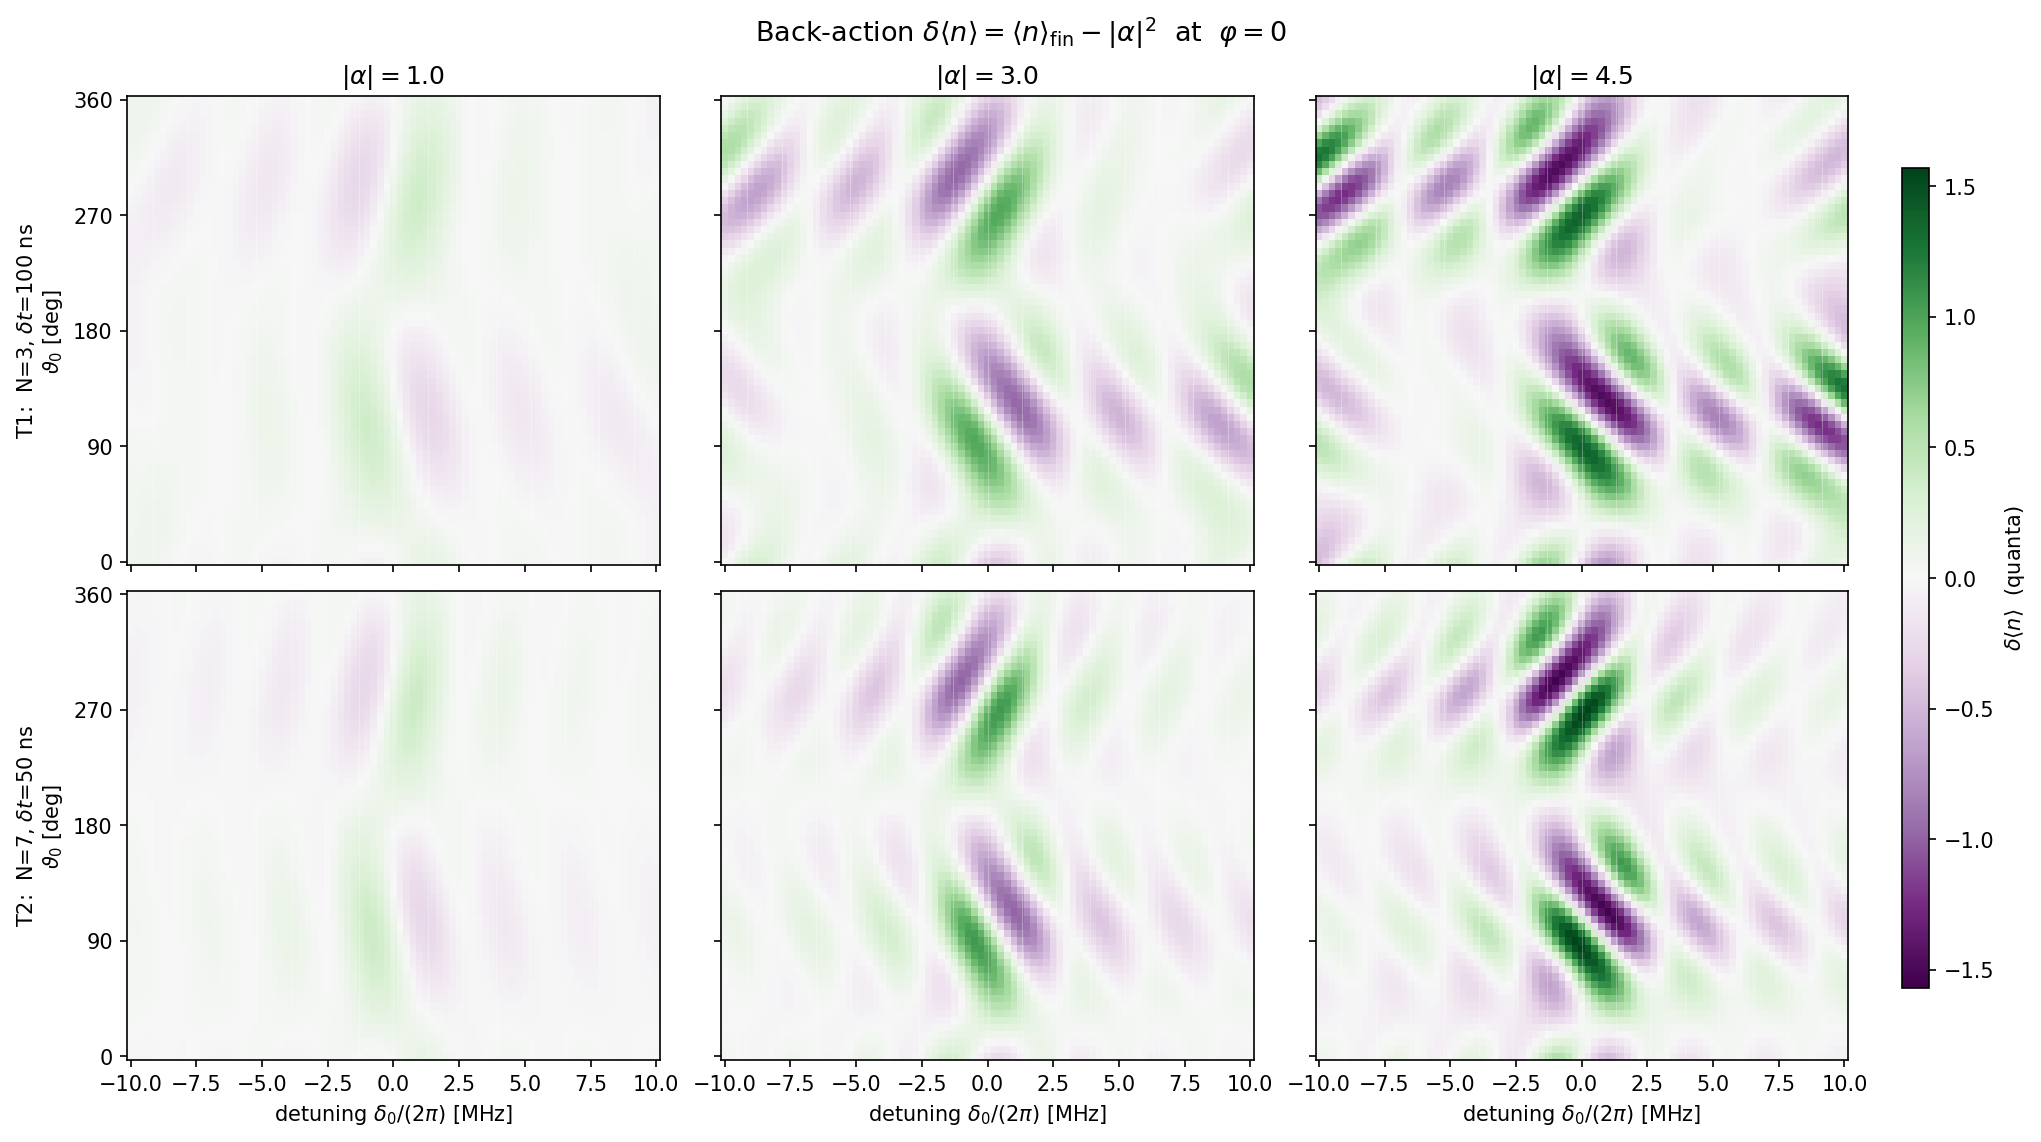
| T1, |α|=3 | 0.962 | 0.949 | 0.975 | 1.111 |
| T1, |α|=4.5 | 0.960 | 0.923 | 1.481 | 1.532 |
| T2, |α|=1 | 0.936 | 0.914 | 0.388 | 0.445 |
| T2, |α|=3 | 0.945 | 0.937 | 1.063 | 1.160 |
| T2, |α|=4.5 | 0.946 | 0.937 | 1.569 | 1.674 |
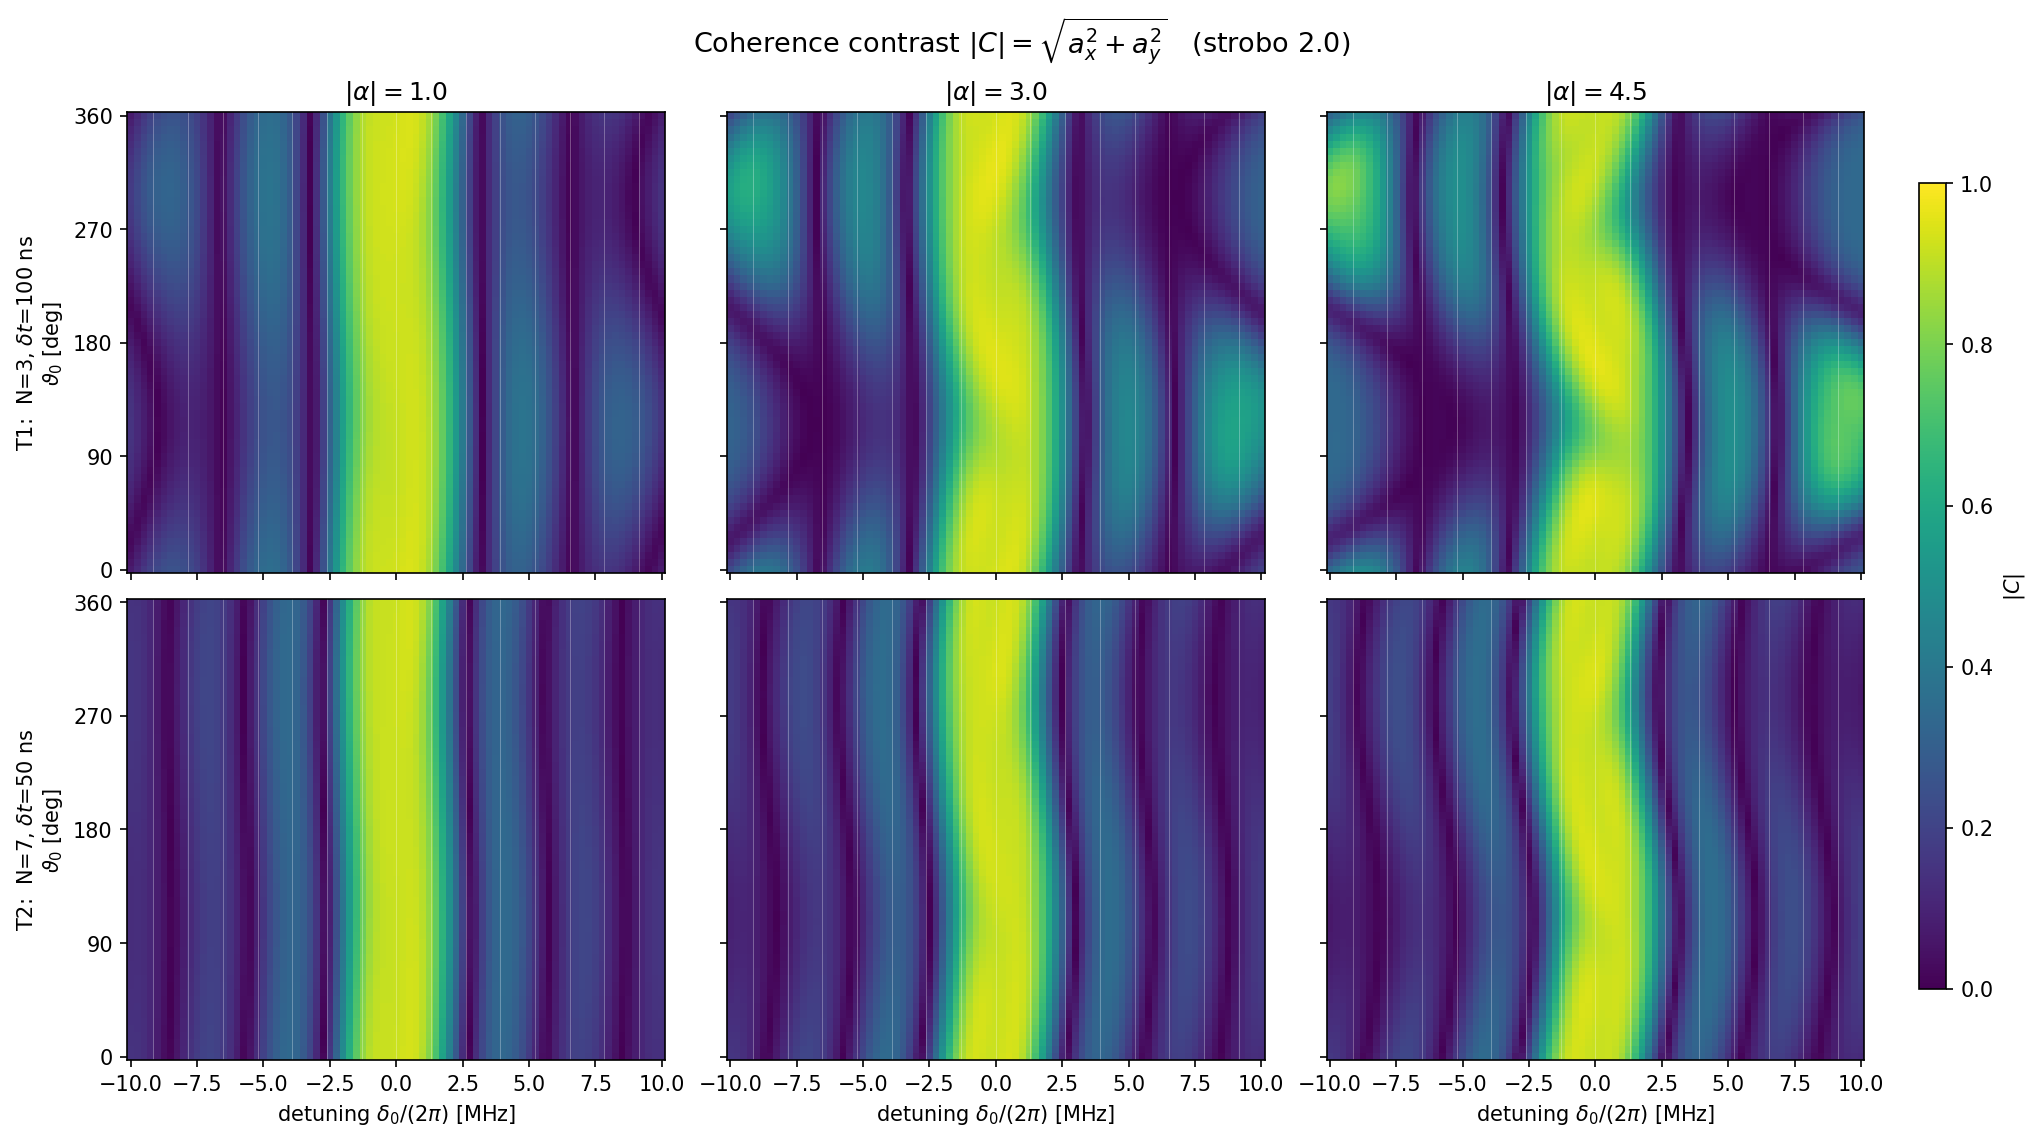
The closed-form weak-pulse-limit prediction on carrier at |α| = 0 is |C| = sin(π/2) = 1 for both trains by construction. The engine result of 0.92 (α = 0 anchor, preflight Test 1) is ~8 % below that limit — a real physical shortfall from intra-pulse motional rotation (ω_m·δt ≈ 0.82 rad for T1, 0.41 rad for T2). This finite-duration Magnus correction is absent from the closed form but present in the engine and therefore in the dataset.
The |C| peak is still essentially |α|-independent across |α| ∈ {1, 3, 4.5}, within ~2 % (for T1 the α-scatter is larger than v0.1, because at the strong-drive calibration the η·|α| nonlinearity feeds back into the carrier amplitude; for T2 the weaker per-pulse rotation suppresses this and the scatter is ~1 %).
Unlike v0.1 (where only the carrier and a faint ±3 ω_m feature survived), the π/2-calibrated sweep shows a broad carrier plus a rich sideband comb. ϑ₀-averaged |C| on T2, α = 3 drops to ≲ 0.05 at |δ₀|/(2π) ≈ 5.75 and ≈ 8.5 MHz — i.e. between sideband peaks. This is the regime where the pulse train resolves individual sidebands (Ω_eff/ω_m ≈ 0.55–0.64, large enough for the drive to populate k-th-order sidebands via η^k coupling, but still well below the fully-broadened strong-drive limit).
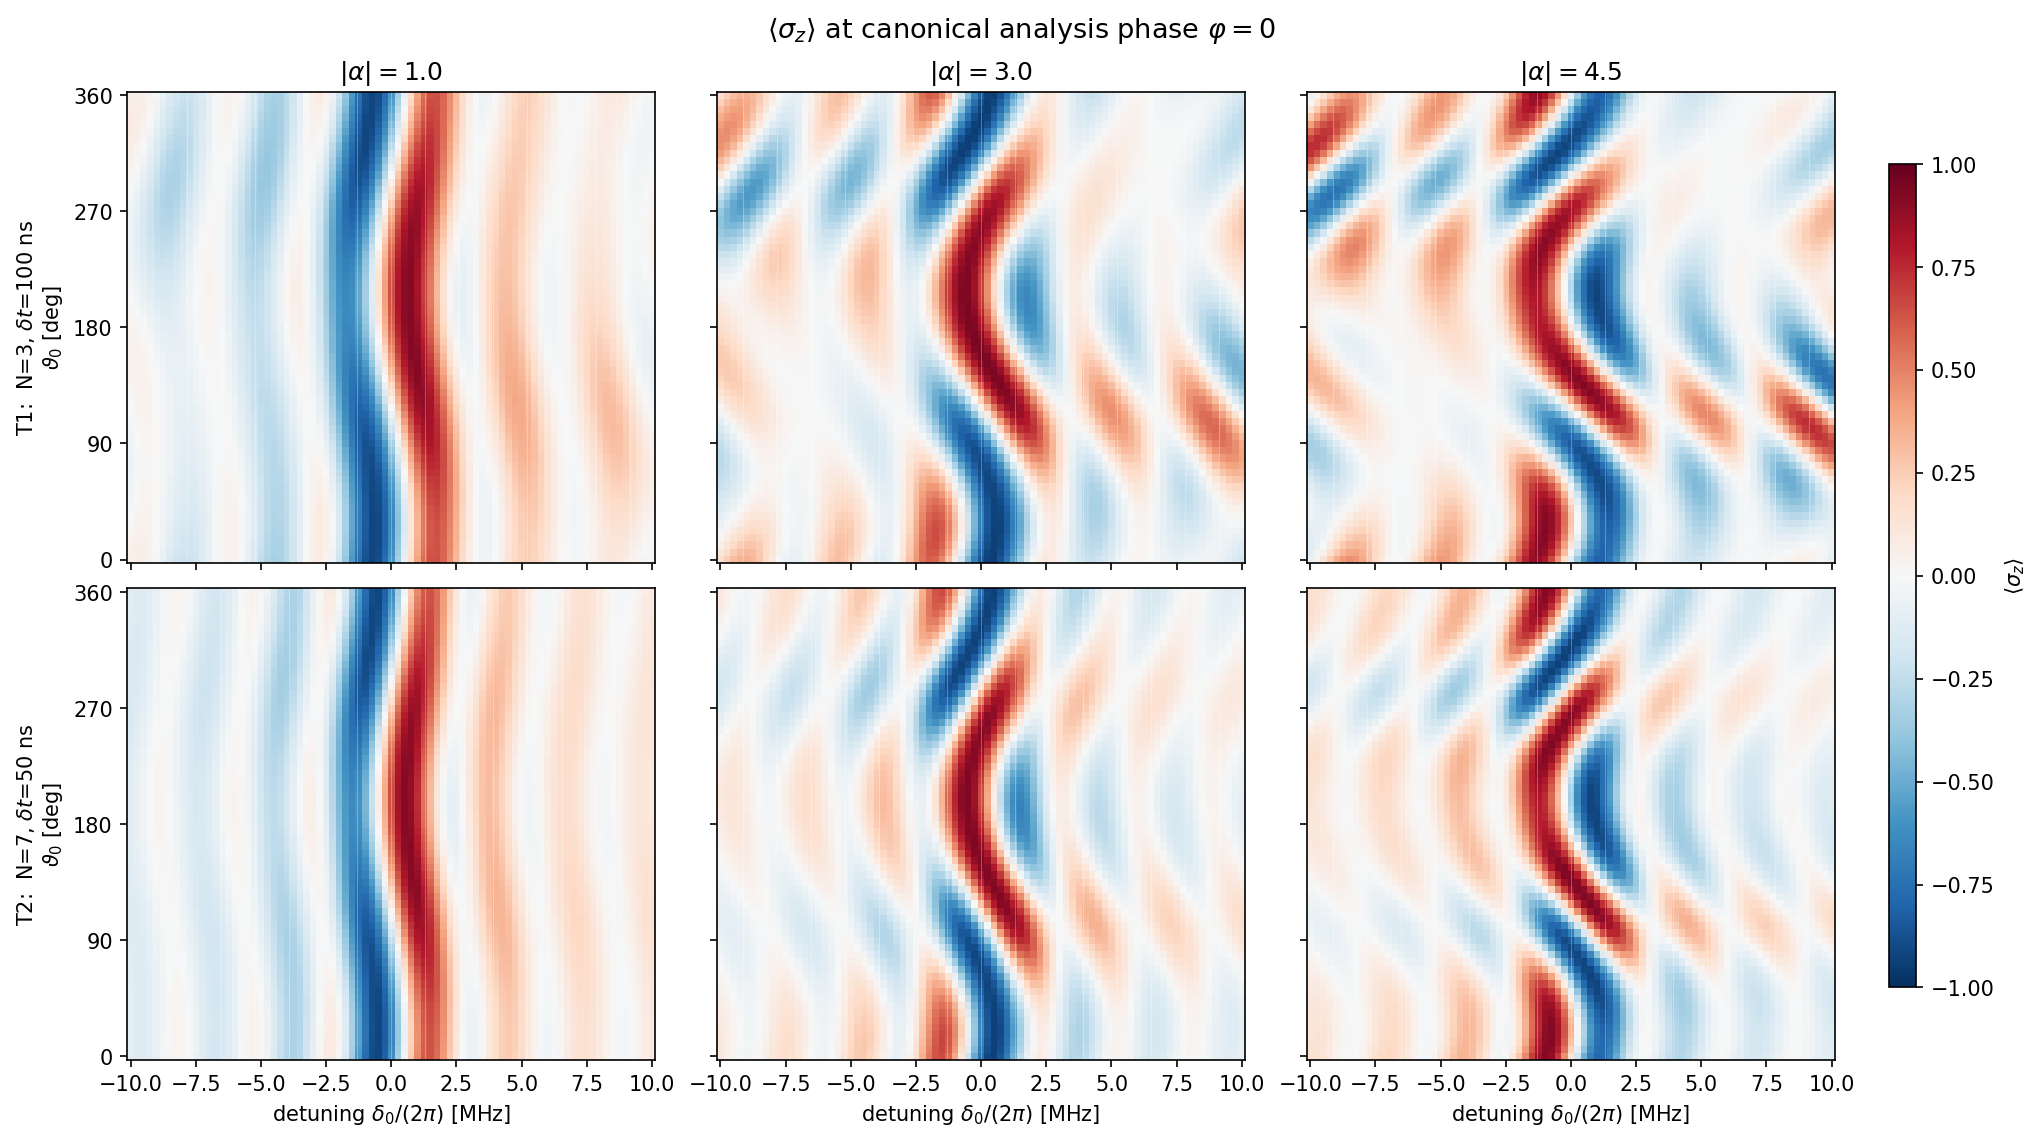
Peak back-action at |α| = 4.5: |δ⟨n⟩| ≈ 1.57 quanta (T1) / 1.67 quanta (T2) — roughly 3× the v0.1 value, matching the 3-4× increase in per-pulse rotation. The φ-antiperiodicity δ⟨n⟩(φ + π, ϑ₀) = −δ⟨n⟩(φ, ϑ₀) is preserved to correlation −0.9996 (vs −1.0000 at weak drive) — the tiny deviation is a finite-pulse correction, not a breakdown. The four-lobe quadrant sign pattern (+, −, −, +) of Hasse Fig. 6(b) is reproduced at |α| = 3 (see 2026-04-21-hasse-fig6-slice.md).
Both trains reach the same saturation peak (|C| ≈ 0.94–0.96) but T2's carrier feature is narrower (longer total duration → tighter Fourier limit). Rough HWHM from the maps:
The 1.5× ratio tracks the total-train-duration ratio as expected. Both are now directly comparable to the Hasse 2024 N = 30 AC analysis-pulse width (≈ 0.2 MHz, from their 23.1 µs total duration) — strobo 2.0's trains are 2–6× broader, as befits their ~4-10× shorter total duration.
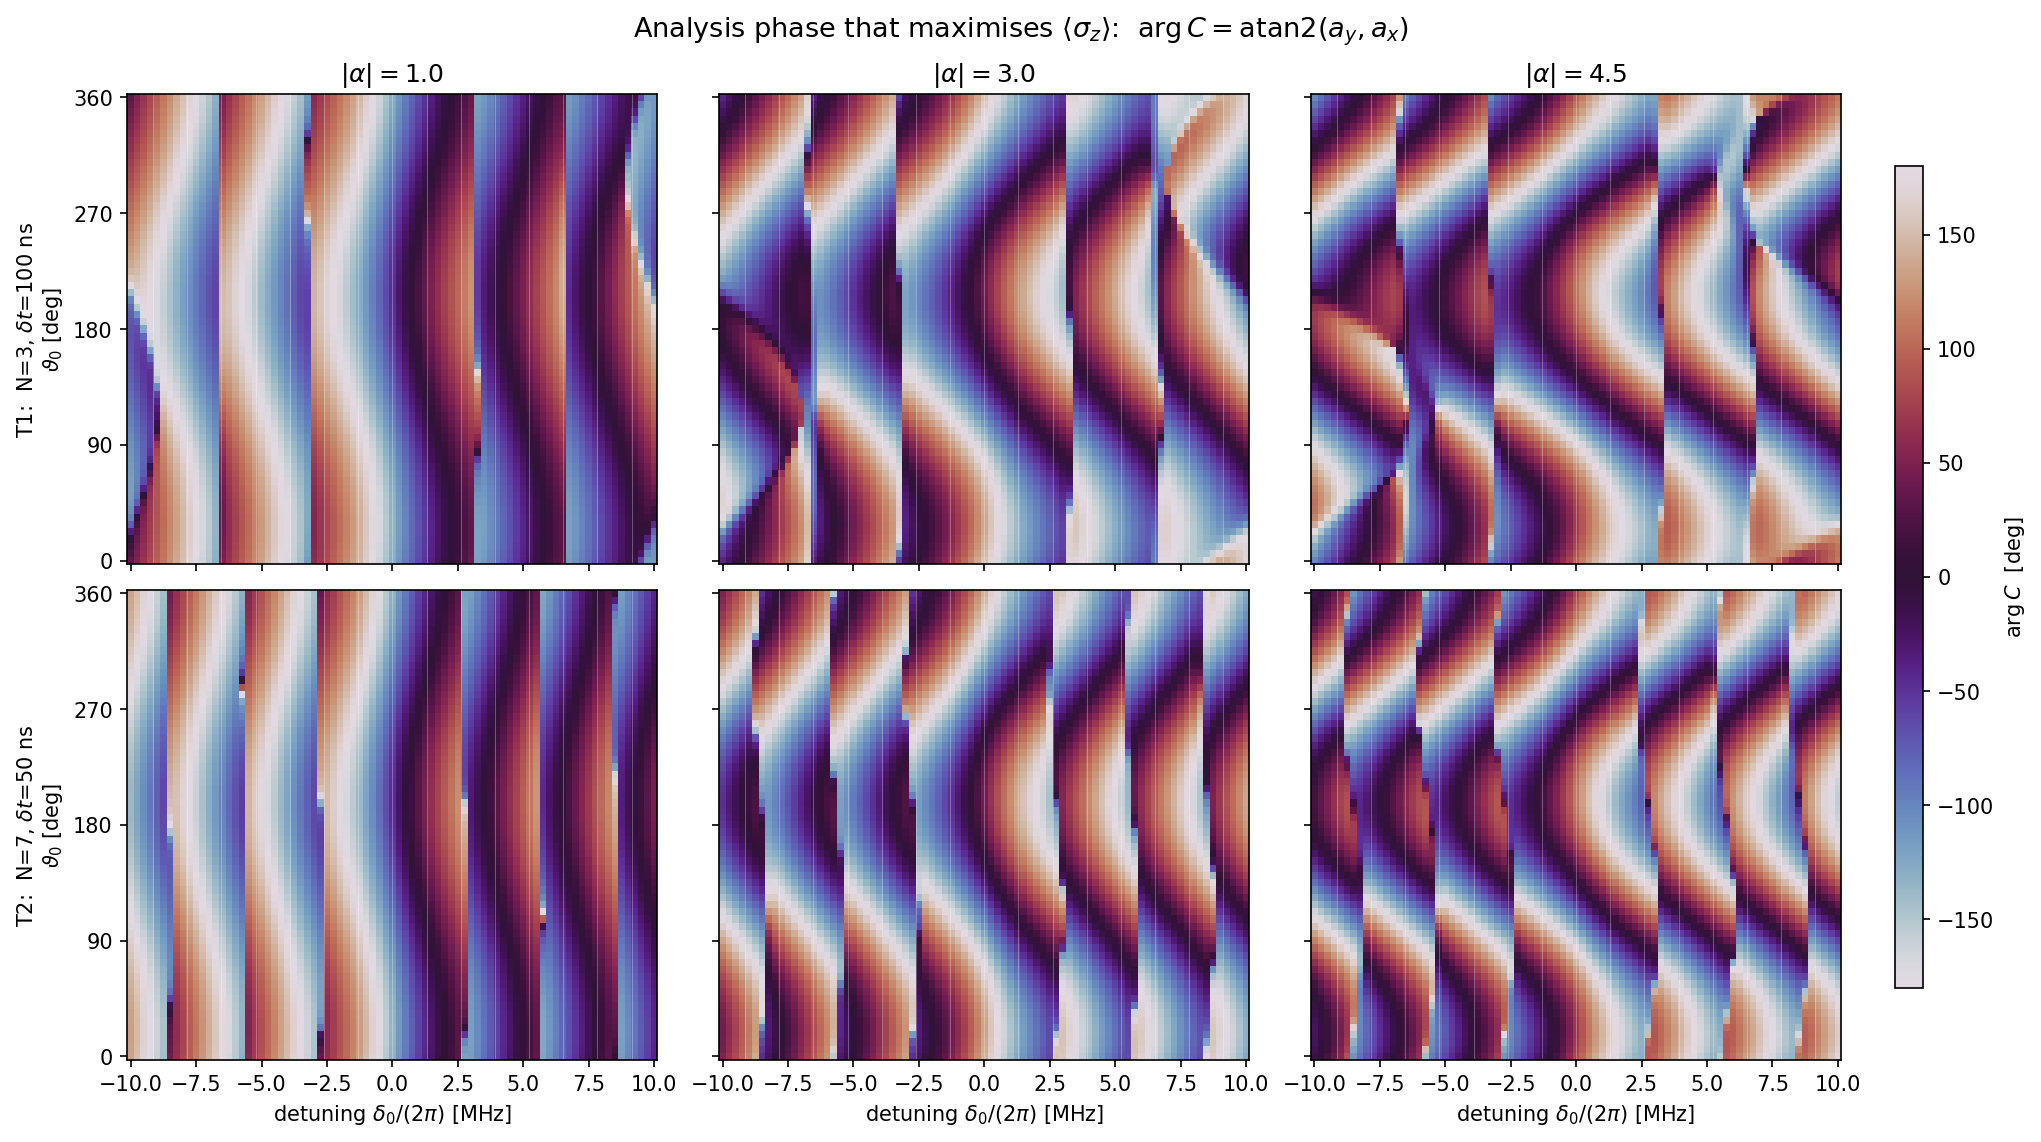
02_arg_C.png shows slanted-stripe patterns similar to v0.1 but with steeper slopes and more visible wrap-arounds — as expected at the stronger drive, the accumulated phase arg C varies more rapidly with both δ₀ and ϑ₀. The slope sign still flips at ϑ₀ ≈ 0 and ϑ₀ ≈ π.
Three bookkeeping notes:
This entry produced six artifacts — the main-sweep dataset, its manifest, and its five figures (re-run from v0.1 layout):
Follow-ups added in their own logs:
The README has the complete up-to-date folder tree.
v0.1 2026-04-21 — weak-probe, single-Ω record. v0.2 2026-04-21 — editorial pass. v0.3 2026-04-21 — π/2-calibrated per train; numbers, findings, history updated. Earlier v0.1/v0.2 descriptions of the dataset are retained as the "History" section; the dataset itself is now the π/2-calibrated run.